Distance–time graph
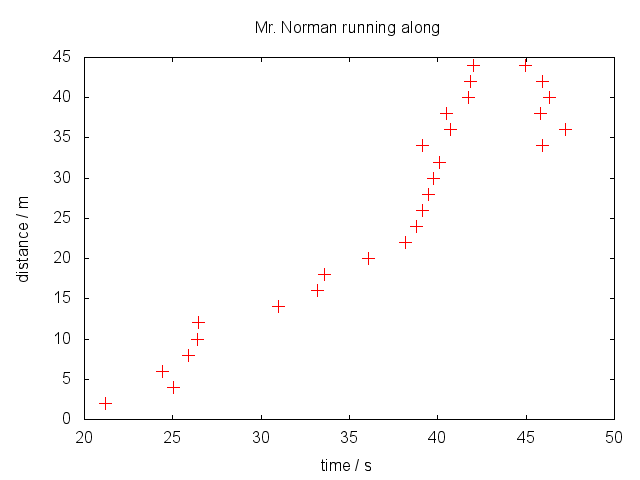
Here are the results from our lesson on 2012-03-20, which show the time taken for me to reach certain distances from a starting point.
Method
The members of the class stood in a long line at 2 m intervals, each with a stopwatch. When I passed each of them on my journey along the line, the time on their stopwatch was recorded.
NB Some of the people near the far and of the line had two times, as I started back along the line!
Results
The distance–time graph is shown below (click on graph for higher resolution image, also available as a PDF here):
The raw data are available as a tab delimited text file.

